Marvellous Monday!
We began the day with math. Today students learned about identify a misleading graph, identify how a graph can be misleading and understand why some graphs display data in a misleading way.


As a class we investigated 2 different graphs that show the same data.
What do the two graphs show? (The average new house prices from 1999-2002)
How are the two graphs similar? (Both of them are double-bar graphs and both sets of axes represent the same things.) What does the horizontal axis on each graph represent? (Time, in years, from 1999-2002) What does the vertical axis on each graph represent? (Price, in thousands of dollars) What do you notice about the scale on the vertical axis of each graph? (The scale for the graph on the left begins at 100 and is 1 square represents $5000. The scale for the graph on the right begins at 0 and is 1 square represents $25 000.) How are the bars on the graph on the left different from the bars on the graph on the right? (On the graph on the right, the bars in each pair are close in height. In the graph on the left, the difference between the heights of each pair of bars is much more obvious.) How are the heights of the bars affected by the scale on the vertical axis? (When the scale begins at 1000 and the scale is 1 square represents $5000, the difference in heights of the bars in each pair is much greater than when the scale begins at 0 and the scale is 1 square represents $25 000.) What impressions does the first graph give? (The average new house prices in Ottawa are generally much higher than those in Hamilton.) What impression does the second graph give? (the average new house prices in the two cities are very similar.) Who might want to use the first graph? (A real estate company in Hamilton, trying to convince people to come to Hamilton to live) Who might want to use the second graph? (A company in Hamilton that is moving its office to Ottawa might use the graph to show its employees that new houses cost about the same in both cities.)
Then students were asked what are some things you can do to draw a misleading graph? (I can use a scale that does not begin at 0; I can use inappropriate intervals on the scale of the graph; I can omit some information, such as labels on an axis.)
Next, we had French.
After first recess and lunch we got into our literature circles and fulfilled our specific roles within our groups for chapter 3.
Then we had music.
Next, we had library time with Ms. Hayward.

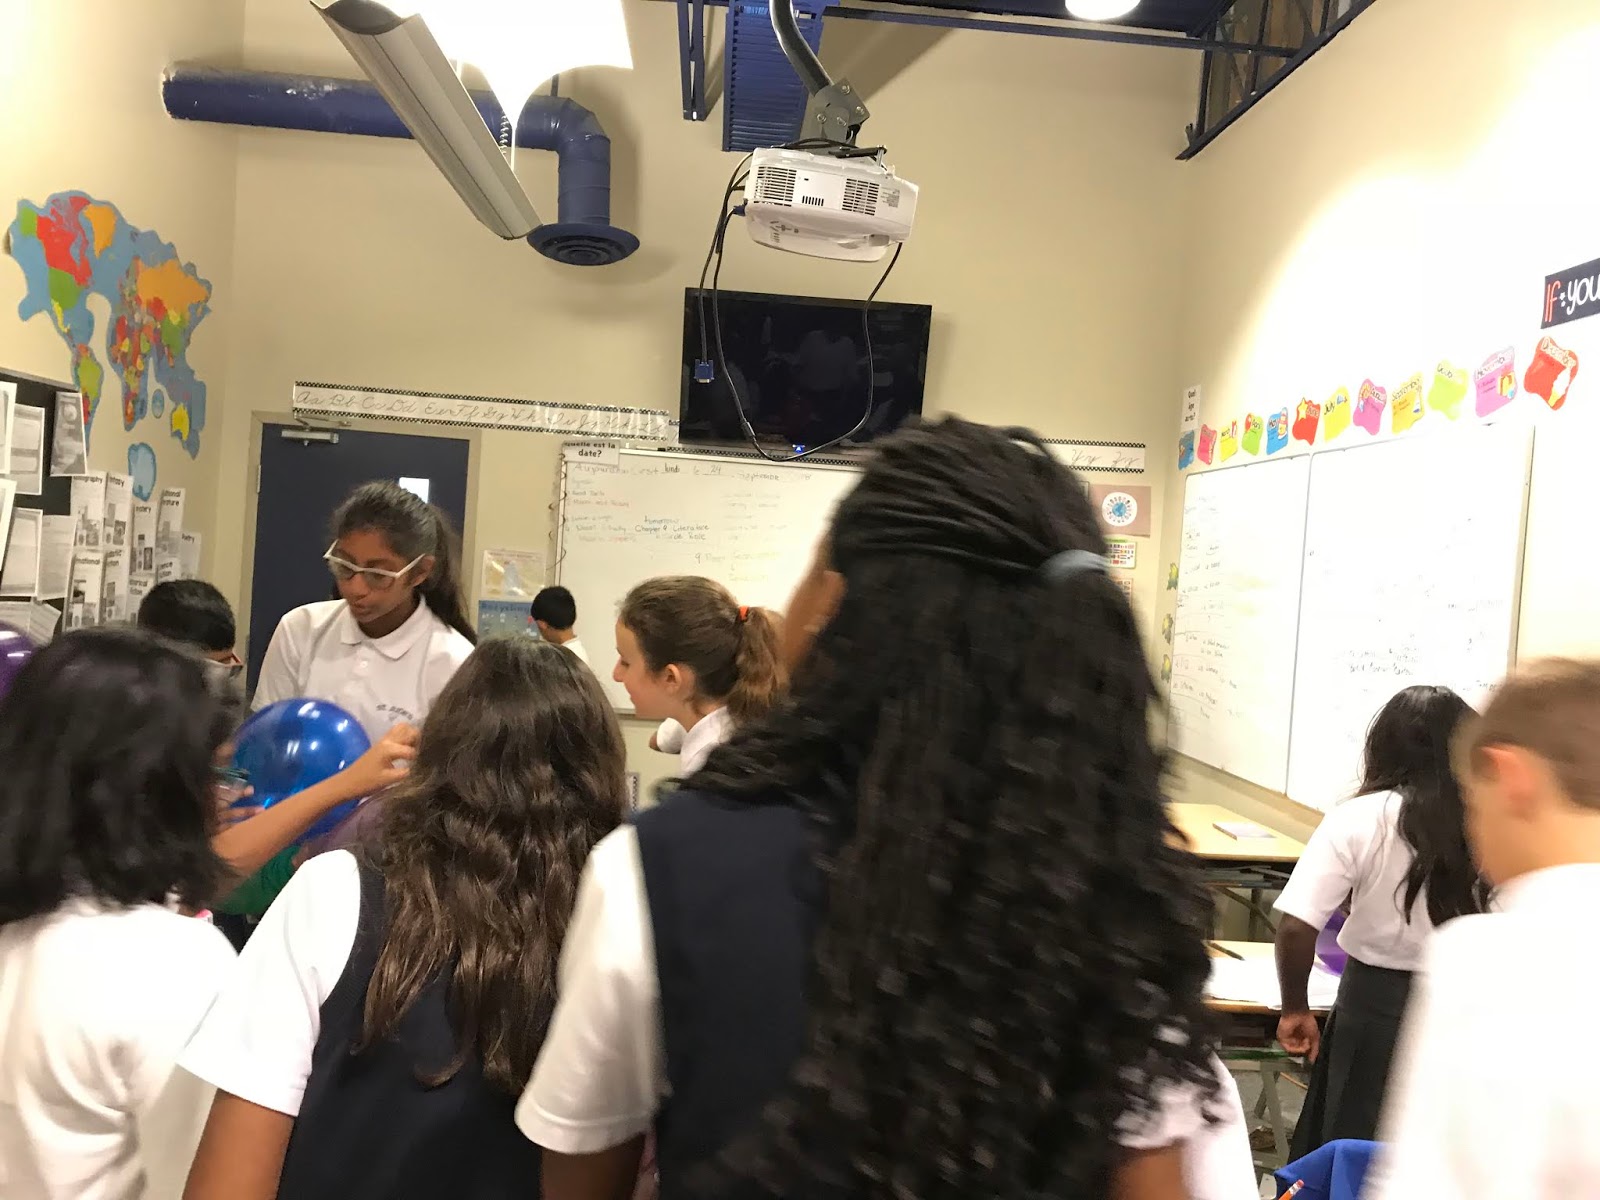
After second recess and lunch we explored static electricity. We first watched a video about static electricity and made notes.
We learned that matter is made up of atoms and that atoms can be positively charged, negatively charged, or have no charge (neutral). We found out that nature likes balance and so that atoms are neutral. Normally the electrons and the protons are evenly balanced, which is why most matter is electrically neutral (no charge/neutral). However, rubbing or friction (static electricity) can give electrons enough energy to leave their atoms and attach to others. As a result, the first object becomes positively charged and the object that accumulates the electrons becomes negatively charged. And so, when given the opportunity the electrons will go where they are most needed (to the positively charged object) in order to create a balance. We then did an experiment using balloons to see static electricity in action!!


After we watched two videos about how to build an electric car in order to get ideas for our science fair and summative project for this unit. Students can watch them again at home:
Students are also asked to begin collecting materials for their electric car construction, e.g. toothpaste-sized boxes, items to be used as wheels (e.g. bottle caps), empty water bottles, etc. These are stored in students’ shoe boxes.
Have a great night!
Homework:
1. Read for 20 minutes
2. Math test Friday
3. UOI test next Tuesday on electricity
4. Novel Study- Chapter 4 literature circle role
5. Math sheets
6. My Challenge for Science Fair
7. Static electricity sheets
8. Bake Sale tomorrow
9. Laptop tomorrow
No comments:
Post a Comment